PeatPulse technical report
1. The problem
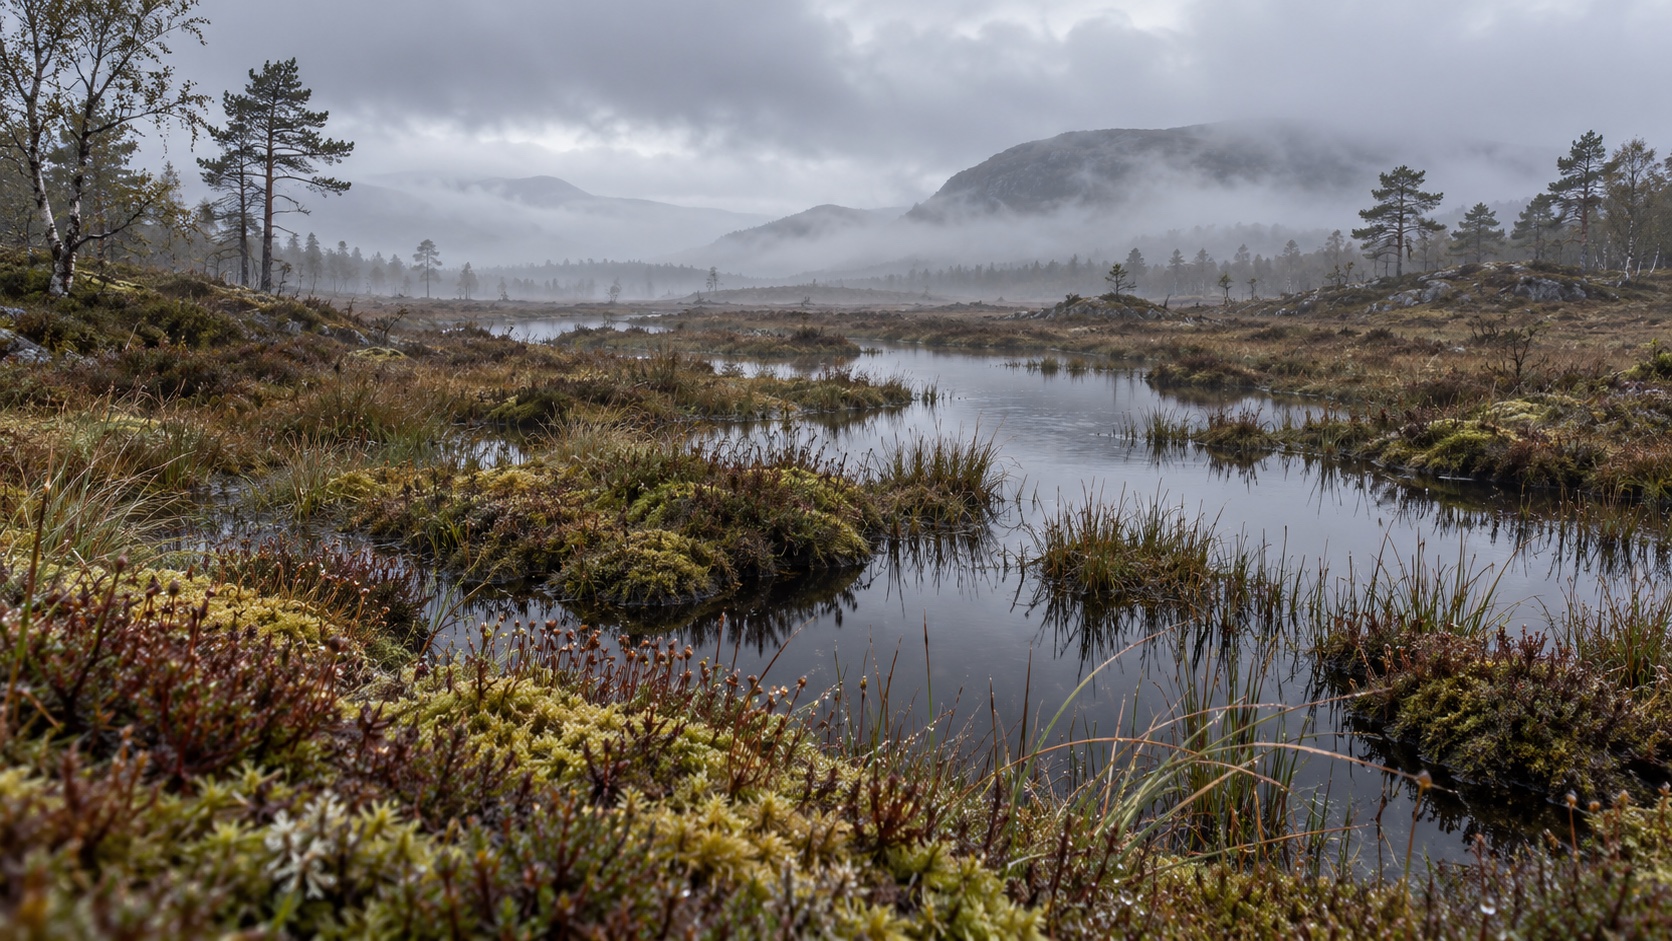
A peatland is a wetland where waterlogged conditions slow the breakdown of dead plants, allowing layers of peat to build up over time. Wikipedia.
A study of UK fires from 2001–2021 found that fires burning into peat caused up to 90% of annual UK fire-driven carbon emissions in particularly dry years. That percentage concerns UK wildfire emissions. The study also highlights the Flow Country fires.
PeatPulse asks a practical question: if a land manager can check only a few peatland patches, which should receive attention first?
We rank Scottish peatland cells for satellite-mapped burning within the next seven days.
On the five-patch daily shortlist, PeatPulse performed 20 percentage points better than Copernicus’s Fire Weather Index (FWI) ranking.
2. The data
We built a dataset by joining public sources by location and date. One row is one fixed 1 km × 1 km cell on one prediction day.
| Source | How we used it |
|---|---|
| NatureScot Carbon and Peatland Map 2016 | Define peatland footprints and sample cells. |
| ERA5 through Open-Meteo | Weather conditions and trailing summaries; approximately 0.25° source grid. |
| Copernicus CEMS through Climate Engine / Earth Engine | Four model inputs; directly ranked FWI is the reference baseline. |
| Sentinel-1 GRD through Earth Engine | Test whether radar adds predictive value. It did not improve the best alert result. |
| NASA FIRMS and NatureScot burn extents | Check uncertain negative labels and connect related burn groups. These are not predictors. |
| Dataset measure | Count |
|---|---|
| Period | 2018–2025 |
| Sampled 1 km cells | 346 |
| Cells with usable training/test rows | 342 |
| Full panel before quality checks | 1,011,012 rows |
| Usable rows | 535,473 |
| Positive rows | 218 |
| Provisional negative rows | 535,255 |
A positive row means the cell has a quality-qualified mapped burn interval inside the following seven days, with at least 24 hours of conservative lead time.
3. The method
The strongest model for our daily shortlist is a Random Forest classifier using 16 weather and CEMS inputs. It gives each location a score, then ranks locations from highest to lowest to help decide which patches to check first. It ranks relative concern; it does not predict whether a fire will happen. These scores have not been calibrated as real-world fire probabilities.
| Input group | Variables |
|---|---|
| Conditions on the prediction day | Temperature, relative humidity, wind speed, vapour-pressure deficit (atmospheric drying demand). |
| Recent conditions | Precipitation over 24 hours, 7 days and 30 days; consecutive dry days; 7-day mean temperature and vapour-pressure deficit. |
| Season | Two numerical values encoding the day of year. |
| CEMS fire indicators | FWI, Drought Code, Duff Moisture Code and Fine Fuel Moisture Code. |
We chose candidate variables based on plausible drying and burning processes and available historical coverage. An initial audit examined missing data, time series and Spearman correlations using geography-selected training locations. It removed duplicate weather-location/day observations from that correlation calculation.
We compared weather alone, weather plus CEMS, and weather plus CEMS plus eight radar features. The radar features were VV/VH levels, changes, deviations from the preceding 90-day median, recent persistence and observation age.
We also trained logistic regression, Extra Trees and histogram gradient boosting. The Random Forest led the tested daily alert policy; Extra Trees gave the best standalone average precision across all rows and dates.
4. How we tested it
We used five-fold grouped cross-validation. A cell’s entire history and its connected burn/comparison cells stay together. For each fold, models train on the other groups and score the withheld groups. Every usable row receives one held-out prediction.
| Fold | Train rows | Train positives | Test rows | Test positives |
|---|---|---|---|---|
| 1 | 486,545 | 202 | 48,928 | 16 |
| 2 | 369,146 | 162 | 166,327 | 56 |
| 3 | 467,075 | 173 | 68,398 | 45 |
| 4 | 342,499 | 148 | 192,974 | 70 |
| 5 | 476,627 | 187 | 58,846 | 31 |
Random Forest candidates used 50 trees with maximum depth 3, or 100 trees with maximum depth 8. Because fire examples are rare, we gave them extra weight, used up to 50,000 no-fire examples while tuning, and used all eligible rows for the final training runs.
The reference is the actual historical Copernicus FWI value, ranked directly. Both methods see identical candidates on identical dates, including candidates with unknown outcomes. If scores tied, we used the same order by location and date.
5. The results
Let’s use the actual example from the report: a historical check at 1pm on 14 April 2019.
What went in
For each 1 km peatland square, the model uses 16 weather and fire-danger measurements. This square in northwest Scotland (57.7355° N, 5.2856° W) had:
- Weather: 8.8°C, 48% humidity, 24 km/h wind, and an air-dryness reading of 0.59 kPa. Its seven-day average temperature was 5.94°C.
- Rain: 0 mm in the last day, 0.1 mm in the last week, and 89.2 mm in the last 30 days; it had been dry for 10 days.
- Copernicus fire-danger readings: FWI 7.18, drought code 24.95, duff moisture code 8, and fine-fuel moisture code 84.91.
- Recent weather summaries and the time of year, also included in the model’s 16 measurements.
How it ranked patches
For that date, the Random Forest compared 103 peatland squares in its test sample. It gave each square a score and sorted them from highest to lowest. This square came 1st, so it made the five-square shortlist.
The score is just for sorting; 0.91 does not mean a 91% chance of fire. Copernicus’s FWI reading alone ranked the same square 59th, outside its top five.
What we checked afterward: the satellite record estimated burning around 19 April, within the following week. That made this a match in the historical test; it is satellite evidence, not an on-the-ground fire report.
Across all test dates, PeatPulse’s five highest-ranked squares included a patch linked to 13 of 25 mapped burn areas at least once. FWI’s list included one linked to 8 of 25. Adjacent squares linked to the same mapped burn count as one area.
6. Running on a laptop
All model fitting and scoring ran on the local CPU. The additional algorithm-comparison experiment completed in 389 seconds (about 6.5 minutes), including its final selected-model refit. That is the experiment runtime, not the total time spent downloading and preparing data.
The saved weather/CEMS Random Forest is approximately 4.6 MB. It uses tabular statistics and decision trees. Earth Engine supplied cloud-based data extraction; the resulting cached dataset, model training and evaluation were local.
This addresses the challenge’s interest in small-compute methods and verifiable baselines. Raspberry Pi execution and energy consumption have not been measured.
7. What this establishes
On this historical grouped benchmark, a learned combination of weather and existing fire-danger indices placed more mapped burn groups on daily shortlists than directly ranked FWI. The experiment also tested the original satellite-radar hypothesis and found no improvement in the main alert metric.
8. Source code
9. Sources
- NatureScot open spatial data : Carbon and Peatland Map 2016.
- Open-Meteo historical weather API : ERA5 extraction.
- Climate Engine CEMS Fire : historical indices through Earth Engine.
- Copernicus Fire Weather Index : baseline meaning and scope.
- MODIS MCD64A1.061 : burned area, dates and quality.
- Sentinel-1 GRD : radar backscatter.
- NASA FIRMS : corroborating thermal detections.
- NatureScot Scottish Wildfire and Muirburn Extents : dated mapped records.
- NatureScot: Flow Country carbon storage, 26 July 2024.
- University of Exeter: peatland fire carbon emissions, 21 February 2025.